Just like the vibrant streets of Sarafa Bazaar in Raipur, teeming with activity and unique interactions, your website also holds a universe of user behavior waiting to be understood. Are visitors lingering on your product pages like they savor the taste of a local Chhattisgarhi thali? Or are they getting lost and frustrated, bouncing off like a cricket ball off a strong bat in Marine Drive? For businesses in Raipur, understanding these digital interactions isn’t just about good practice; it’s about connecting with your local audience, building trust, and driving growth in a competitive online landscape. In today’s digital age, a superior Website UX is paramount, and two of the most powerful tools in your arsenal are heatmaps and session recording.UI/UX
In the bustling digital marketplace, your website is often the first impression a potential customer from Raipur has of your business. A clunky, confusing, or frustrating user experience (UX) can send them straight to a competitor, no matter how great your products or services are. This is where website analytics tools like heatmaps and session recording become invaluable. They provide a window into the minds of your users, revealing what they do, where they click, how far they scroll, and why they might be abandoning your site. By leveraging these powerful tools, businesses in Raipur can move beyond guesswork, making data-driven decisions to significantly improve their website UX, leading to higher engagement, better conversion rates, and ultimately, a stronger online presence in Raipur. This comprehensive guide will walk you through the intricacies of heatmaps and session recording, demonstrating how to effectively analyze the data and implement changes that will truly transform your website’s performance.
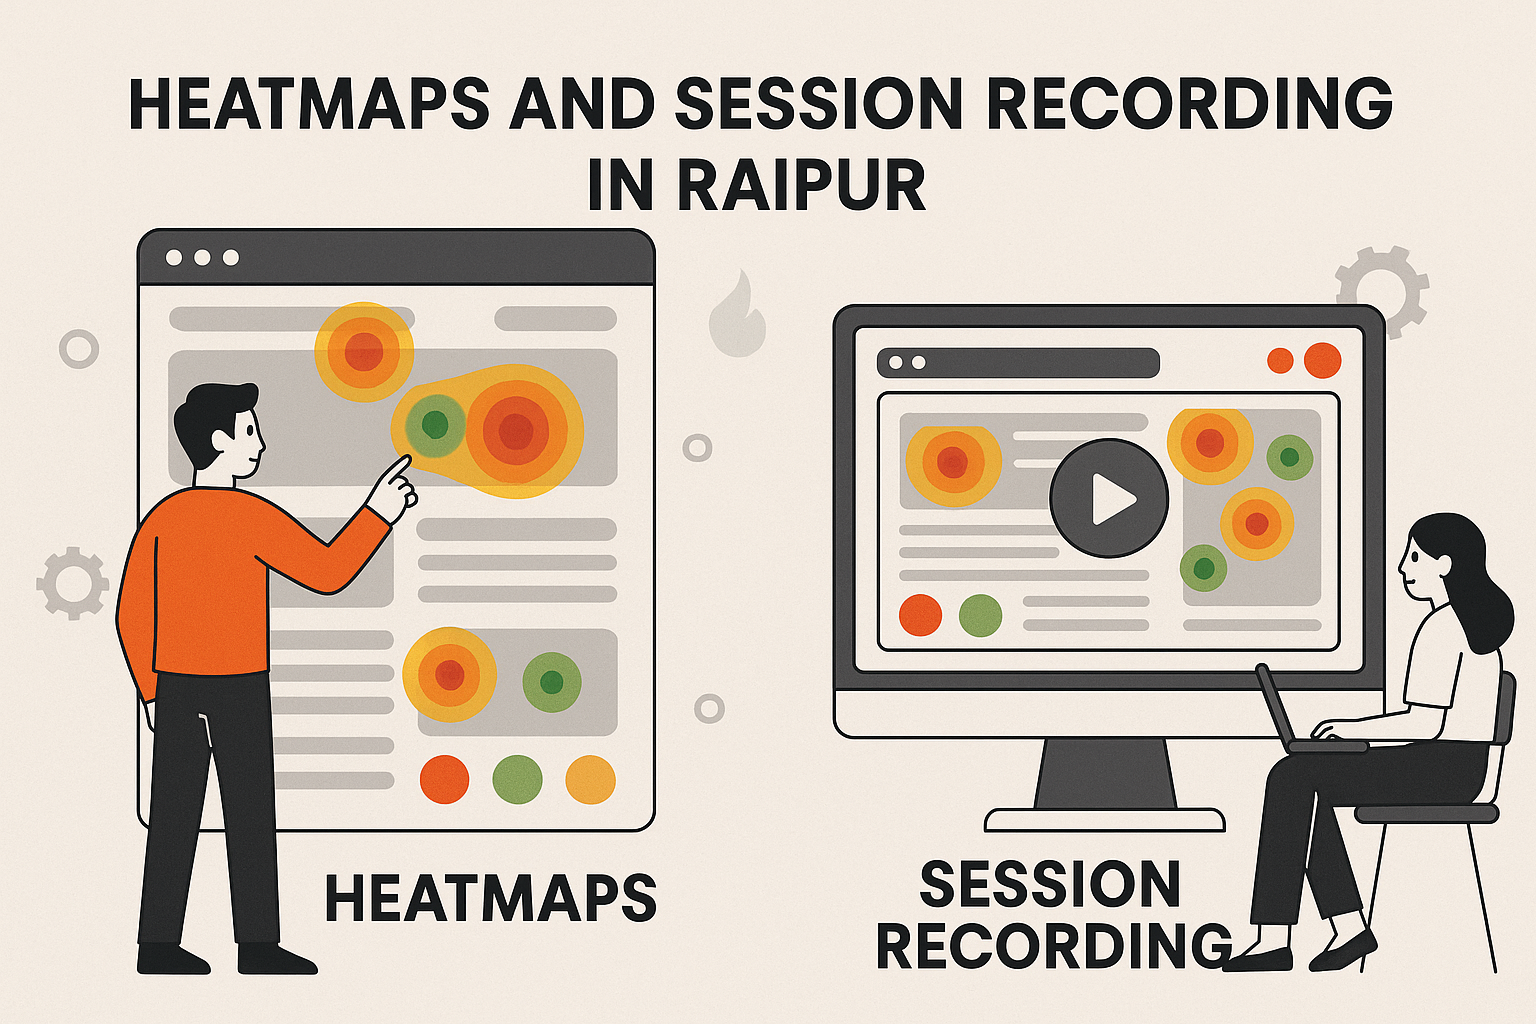
Understanding Heatmaps: Visualizing User Attention
Heatmaps are graphical representations of data where values are depicted by color. In the context of website UX, they use a color spectrum (typically from red for “hot” or high engagement, to blue for “cold” or low engagement) to show user interaction on a webpage. Imagine a thermal camera for your website – that’s essentially what a heatmap offers.
There are several types of heatmaps, each providing unique insights into user behavior:
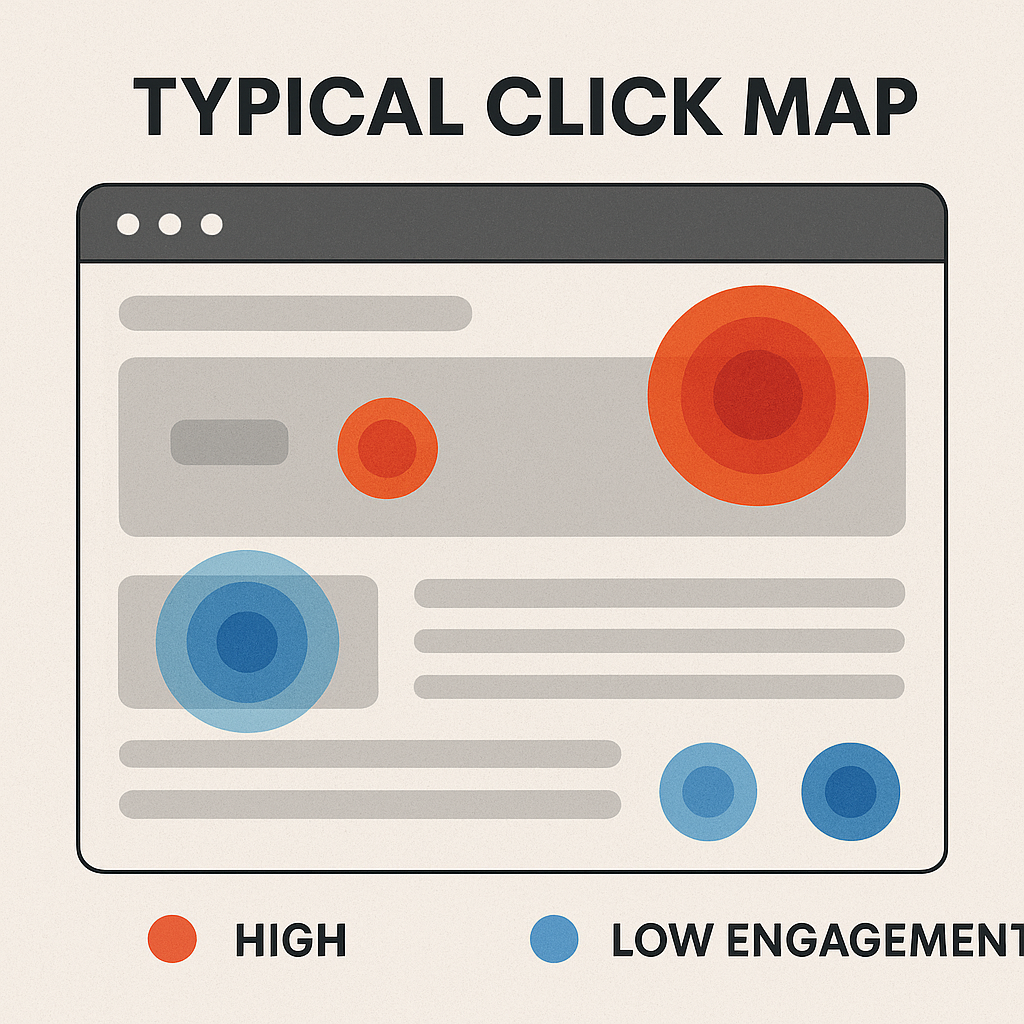
- Click Maps: These are perhaps the most common type of heatmap, showcasing exactly where users click on a page. Hotter areas indicate more clicks. This can reveal if users are clicking on non-clickable elements, ignoring crucial calls to action, or engaging with unexpected areas. For a Raipur-based e-commerce store, a click map might show customers are repeatedly clicking on an image that isn’t a link, indicating a missed opportunity for conversion.
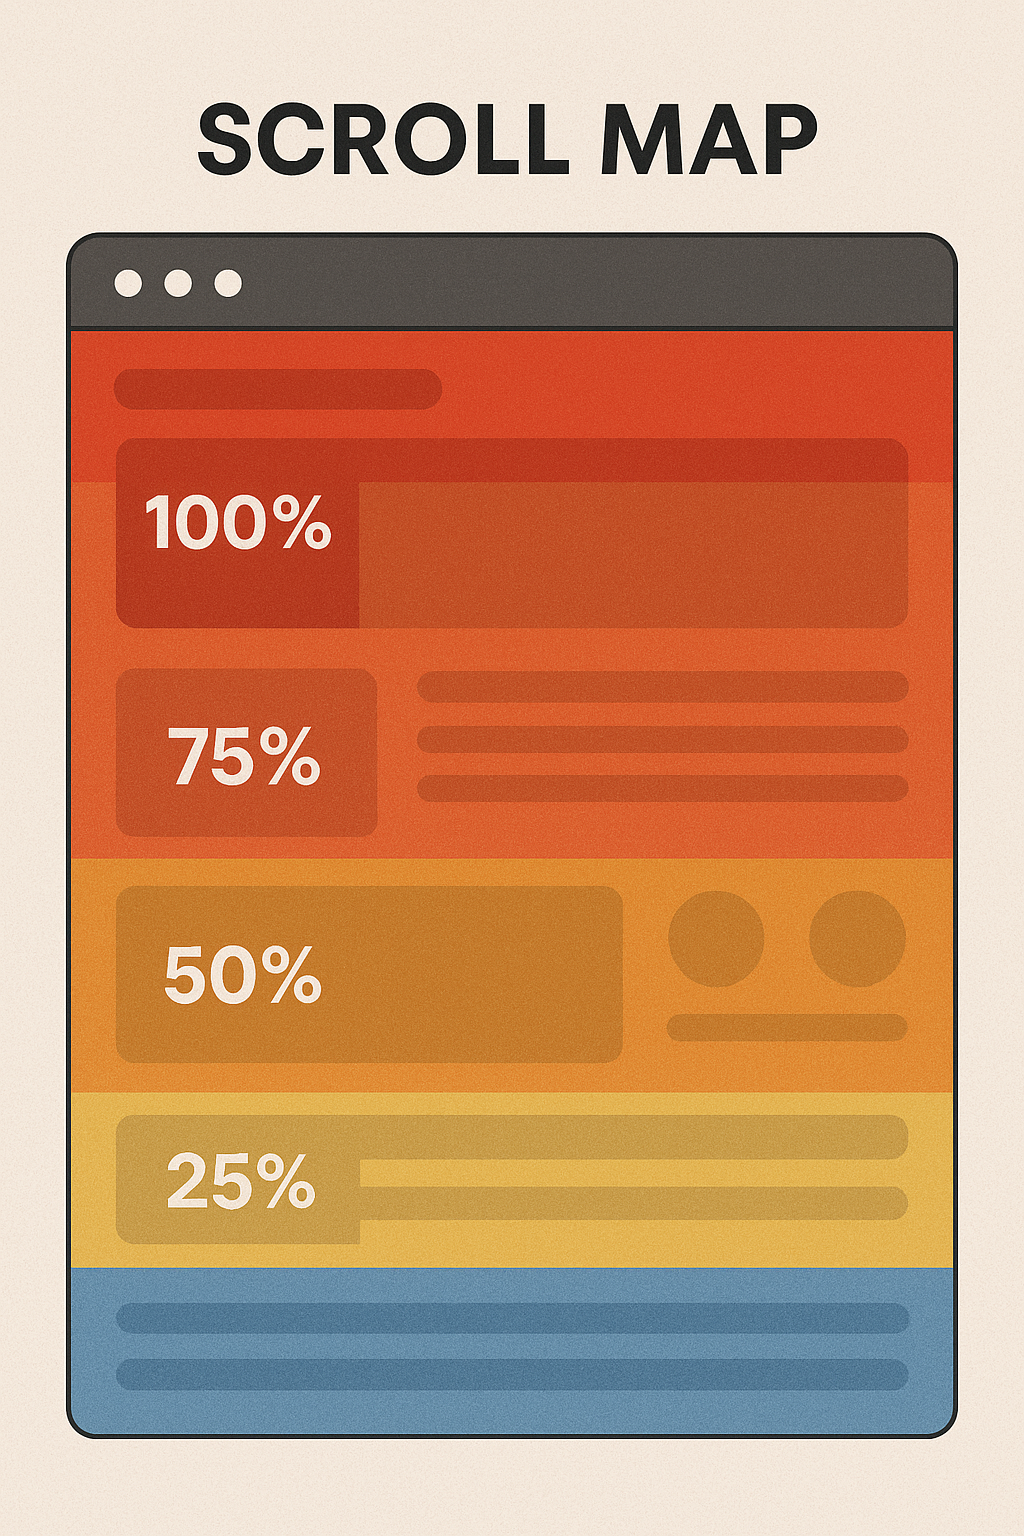
- Scroll Maps: Scroll maps illustrate how far down a page users scroll. They use a gradient from red (visible to most users) to blue (visible to very few). This is crucial for understanding the “fold” – the point where users stop scrolling. If your key information or Call to Action (CTA) is consistently below the fold for the majority of your Raipur audience, you’re losing visibility.
- Movement Maps (or Hover Maps): These heatmaps track mouse movements, showing where users hover their cursors. While not always indicative of direct engagement, a cursor lingering over a particular section often suggests interest or, conversely, confusion. This can be particularly useful for content-heavy pages relevant to the Raipur demographic, such as local news or service listings.
- Confetti Maps: A more granular version of a click map, confetti maps display individual clicks as small dots, often color-coded by referral source, visitor type, or other parameters. This allows for deeper segmentation and analysis of specific user groups from Raipur.
Why Heatmaps are Essential for Website UX:
Heatmaps offer a quick, intuitive visual understanding of website performance. They answer critical questions such as:
- Are users seeing my most important content or CTAs?
- Are they clicking on what I want them to click on?
- Are there areas of confusion or “dead clicks” (clicks on non-clickable elements)?
- Is my content effectively engaging users, encouraging them to scroll further?
For businesses aiming for digital marketing in Raipur, understanding these nuances can be the difference between a thriving online presence and a stagnant one.
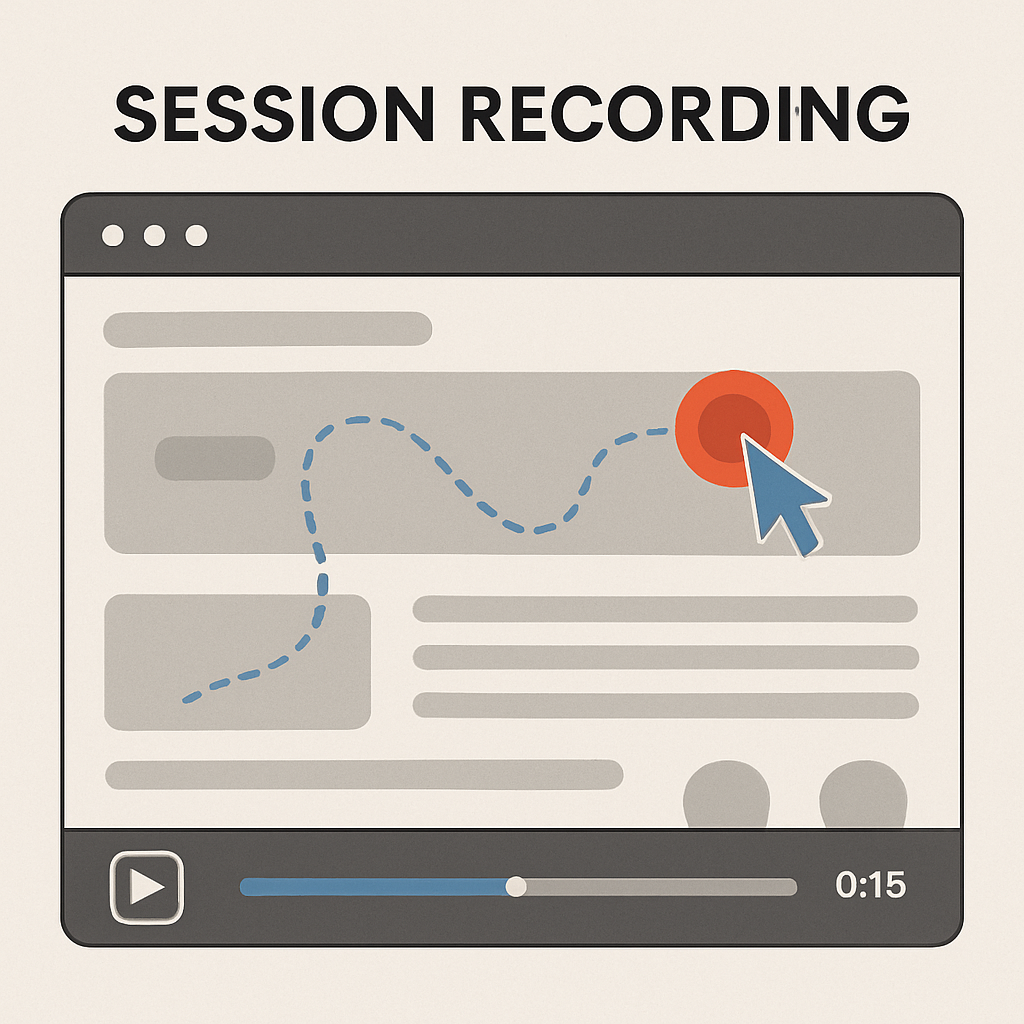
Session Recording: Reliving the User Journey
While heatmaps provide aggregate data, session recording offers a more personal, in-depth view. Session recording, also known as session replay, captures actual user sessions on your website as videos. It’s like looking over the shoulder of every visitor as they navigate your site, showing every mouse movement, click, scroll, and form interaction.
The Power of Session Recordings for Website UX:
Session recordings bring the data from heatmaps to life. They provide the “why” behind the “what.” For instance, a heatmap might show low engagement on a particular section, but a session recording can reveal why: perhaps a critical form field isn’t working, an image is loading slowly, or the navigation is confusing.
Key benefits of session recording include:
- Identifying Friction Points: Watch users struggle with navigation, repeatedly click on broken links, or abandon forms. These “rage clicks” or “frustration signals” are goldmines for UX improvement.
- Understanding User Flow: See the actual paths users take through your website. Are they following your intended conversion funnel, or are they deviating unexpectedly? For a service provider in Raipur, this could mean seeing if potential clients easily find your “Request a Quote” page.
- Debugging UI/UX Issues: Observe broken elements, unresponsive buttons, or design flaws that might not be apparent in standard analytics. This is especially helpful for identifying mobile responsiveness issues for users accessing your site from various devices in Raipur.
- Optimizing Forms: Watch how users fill out forms. Where do they hesitate? Which fields are left blank? This can inform form design changes to improve completion rates.
- Gaining Qualitative Insights: Beyond the numbers, session recordings offer qualitative understanding of user intent and pain points.
Analyzing Heatmaps and Session Recordings for UX Improvement:
Effective analysis of these tools requires a systematic approach. Here’s how to do it:
- Define Your Goals: Before you dive into the data, identify what you want to learn. Are you trying to improve conversion rates for a specific product in Raipur? Reduce bounce rate on a landing page? Understand why users abandon a checkout process?
- Segment Your Data: Don’t look at all users as one homogenous group. Segment by:
- Traffic Source: Do users from social media behave differently than those from organic search?
- Device Type: Mobile users in Raipur might interact very differently from desktop users.
- New vs. Returning Users: Returning customers might have different navigation patterns.
- Geographic Location: Crucially, for your Raipur focus, analyze data specifically from Raipur to understand local preferences and challenges.
- Conversion Status: Compare sessions of users who converted with those who didn’t.
- Identify Patterns on Heatmaps:
- Hot Spots on Non-Clickable Elements: If users are consistently clicking on images or text that aren’t links, consider making them clickable or clarifying their purpose.
- Cold Spots on Important Elements: If your main CTA or critical information is in a “cold” area, it’s likely being missed. Relocate it to a more visible spot.
- Shallow Scrolling: If scroll maps show most users don’t go past the first fold, re-evaluate your content hierarchy. Is the most engaging content at the top?
- Anomalies: Look for unusual patterns – are users clicking repeatedly in one spot, suggesting frustration?
- Watch Key Session Recordings:
- Frustrated Sessions: Look for signs of frustration like “rage clicks” (multiple rapid clicks on the same spot), erratic mouse movements, or quick back-and-forth navigation.
- Abandoned Sessions: Watch sessions where users exited the site unexpectedly, especially from critical pages like checkout or contact forms.
- Conversion Sessions: Analyze successful conversions to understand the optimal user path and replicate it.
- Segmented Sessions: Watch sessions from your identified segments (e.g., mobile users in Raipur) to uncover specific issues.
- Hypothesize and Prioritize: Based on your observations, formulate hypotheses about why certain behaviors are occurring. Prioritize the issues that have the biggest impact on your goals and are feasible to fix.
- Implement Changes and A/B Test: Make the necessary changes to your website. Crucially, don’t just assume your changes will work. Use A/B testing to compare the new version with the old. This scientific approach ensures your UX improvements are truly effective. For example, if you’re a restaurant in Raipur, test a new menu layout based on heatmap insights.
- Monitor and Iterate: Website UX improvement is an ongoing process. Continuously monitor your heatmaps and session recordings after implementing changes to see their impact and identify new areas for optimization.
Popular Heatmap and Session Recording Tools (WordPress Friendly):
For your WordPress website, integrating these tools is straightforward. Many popular options offer plugins or simple code integration:
Inspectlet: Provides heatmaps, session recordings, and form analytics to pinpoint user struggles.
Hotjar: A widely recognized all-in-one tool offering heatmaps, session recordings, surveys, and feedback polls. Excellent for comprehensive user behavior analytics.
Microsoft Clarity: A completely free tool providing unlimited heatmaps, session recordings, and insights with no traffic limits. A great starting point for any Raipur business.
Crazy Egg: Another popular choice known for its various heatmap types (confetti, overlay, scroll) and A/B testing capabilities.
Lucky Orange: Offers heatmaps, session recordings, live chat, and conversion funnel analysis, providing real-time insights.
FAQs:
To further enhance the blog’s SEO and provide value, here are some FAQs:
Q1: What’s the main difference between heatmaps and session recordings? A1: Heatmaps provide aggregated visual data, showing overall trends of clicks, scrolls, and movements across many users. Session recordings, on the other hand, show individual user journeys as video replays, offering detailed qualitative insights into specific interactions and potential frustrations. Think of heatmaps as the “what” and session recordings as the “why.”
Q2: How often should I analyze my heatmaps and session recordings? A2: The frequency depends on your website’s traffic volume and the pace of changes you implement. For high-traffic sites or during A/B tests, daily or weekly analysis might be beneficial. For smaller sites or stable periods, a monthly or bi-monthly review is often sufficient. The key is to analyze after significant website changes or marketing campaigns to understand their impact on user behavior.
Q3: Can these tools help improve my local SEO in Raipur? A3: Absolutely! While heatmaps and session recordings don’t directly influence local search rankings, they indirectly boost your local SEO. By optimizing your website UX based on insights from Raipur users, you improve key ranking factors like dwell time, bounce rate, and conversion rates. A better user experience means happier local customers, leading to positive reviews and stronger brand signals, which all contribute to better local visibility in Raipur.
Q4: Are there any privacy concerns with using session recording? A4: Yes, privacy is a critical consideration. Most reputable session recording tools offer features to mask sensitive information (like credit card numbers, personal data in form fields) to ensure compliance with privacy regulations like GDPR and CCPA. It’s crucial to disclose to your users that you are tracking their behavior (often through a clear cookie notice or privacy policy) and to only record data that is truly necessary for UX improvement.
Q5: What are some immediate UX improvements I can make based on heatmap insights?
A5:Place CTAs strategically: Use click map data to position your calls to action where they receive the most attention.
- Optimize above the fold content: Ensure your most important content and CTAs are visible without scrolling if scroll maps show shallow engagement.
- Fix “dead clicks”: If click maps show users clicking on non-interactive elements, either make them clickable or redesign to avoid confusion.
- Improve navigation: If heatmaps reveal users struggling to find key links, simplify your menu or add more prominent navigation elements.
Ready to truly understand your website visitors in Raipur and transform their online experience? Don’t let valuable insights slip away. Our team of UI/UX design experts in Raipur specializes in leveraging heatmaps and session recording to unlock your website’s full potentialhttps://webitof.com/. Contact us today for a free website UX analysis and discover how data-driven design can boost your conversions and strengthen your digital presence right here in Raipur! Let’s make your website as welcoming and efficient as the best services Raipur has to offer.https://webitof.com/contact/